Creating a Radar Map
Once upon a time, I considered becoming a meteorologist. I was the kind of kid who was always outside—much to my mom's dismay, that included running out into the rain. “Creek walking,” as we called it, was our thing. When the water rose, so did our hopes of rafting down it. You can imagine my mom's joy when I survived childhood mostly intact, only to discover that my first skydive came the moment I was old enough to sign the waiver.
Skydiving through falling rain hurts, by the way.
As fate would have it, I also began my career in software development around that time. In 2005, I joined the weather branch of Universal Weather and Aviation—then called ImpactWeather—as a software developer, and since then I've been exploring the weather through technology. Now part of StormGeo, ImpactWeather may be in the past, but I still keep one eye on the skies—and a lot more experience building tools to plan my next creek-walking adventure.
Follow along as I build a radar map for a new project at stormlio.com.
Overview
In this guide, I'll show you how to create your own weather radar images using publicly available data and tools. The goal is to prototype a straightforward, end-to-end method for building a functional radar map. Each component could easily warrant its own deep dive, but for now, I'll hit the high notes to get you from raw data to a working visualization.
By the end, you'll have a fully functional radar map—and a few techniques for exploring weather data to fuel your own adventures.
The Radar Data
Radar ground stations scan horizontally while tilting vertically, producing multiple data layers. These layers are available individually or as composites. For this project, we'll use the Multi-Radar Multi-Sensor (MRMS) 2D composite reflectivity product from NOAA. It's quality-controlled to remove false echoes and artifacts.
- Format: GZIP-compressed GRIB2 files
- Challenge: GRIB2 can be inconsistent across tools and sources
- Solution: Use GDAL, which handles MRMS data reliably
Development Environment
We'll use Python and GDAL to process the radar data. This approach avoids cluttering your workspace with temporary files and lets us handle everything in one script.
Requirements
requests==2.31.0
osgeo==0.0.1
Sanity Check Script
#!/usr/bin/python3

from pprint import pprint
from osgeo import gdal, gdalconst

def main():
    source_url = ('https://mrms.ncep.noaa.gov'
        '/data/2D/MergedReflectivityQCComposite/'
        'MRMS_MergedReflectivityQCComposite.latest.grib2.gz')


    ds = gdal.Open(f'/vsigzip//vsicurl/{source_url}')
    meta = ds.GetRasterBand(1).GetMetadata()
    ds = None

    pprint(meta);

if __name__ == '__main__':
    main()
If your setup is correct, you'll see metadata output like:
{'GRIB_COMMENT': 'Composite Reflectivity Mosaic (optimal method) [dBZ]',
 'GRIB_DISCIPLINE': '209',
 'GRIB_ELEMENT': 'MergedReflectivityQCComposite',
 'GRIB_FORECAST_SECONDS': '0',
 'GRIB_IDS': 'CENTER=161(US-OAR) SUBCENTER=0 MASTER_TABLE=255 LOCAL_TABLE=1 '
             'SIGNF_REF_TIME=3(Observation_time) REF_TIME=2024-02-05T20:14:37Z '
             'PROD_STATUS=2(Research) TYPE=7(Processed_radar_observations)',
 'GRIB_PDS_PDTN': '0',
 'GRIB_PDS_TEMPLATE_ASSEMBLED_VALUES': '10 0 8 0 97 0 0 0 0 102 0 500 255 1 0',
 'GRIB_PDS_TEMPLATE_NUMBERS': '10 0 8 0 97 0 0 0 0 0 0 0 0 102 0 0 0 1 244 255 '
                              '1 0 0 0 0',
 'GRIB_REF_TIME': '1707164077',
 'GRIB_SHORT_NAME': '500-GPML',
 'GRIB_UNIT': '[dBZ]',
 'GRIB_VALID_TIME': '1707164077'}
About the Map
We'll display radar images on a Leaflet map using OpenStreetMap tiles. First, we need to reproject the data to EPSG:3857 (Web Mercator):
gdal.Warp(
    '/vsimem/reprojected.tiff',
    dstSRS='EPSG:3857',
    srcDSOrSrcDSTab=ds,
    resampleAlg=gdalconst.GRA_Average
)
Adding Color
Radar reflectivity is measured in dBZ (decibels relative to Z). We'll assign colors to each value using a custom ramp:
-999 0:0:0:0
-99 0:0:0:0
75 153:85:201
70 255:0:255
65 192:0:0
60 220:0:0
55 255:0:0
50 255:144:0
45 231:192:0
40 255:255:0
35 0:144:0
30 0:200:0
25 0:255:0
20 0:0:246
15 1:160:246
10 0:236:236
5 119:119:119
0 169:168:125
-5 214:212:173
-10 115:74:119
-15 163:127:167
-20 208:175:212
-25 216:210:233
-30 221:254:255
-35 204:221:221
Save this as radar_ramp.txt, then apply it:
gdal.DEMProcessing(
    'latest.png',
    ds,
    'color-relief',
    colorFilename="./radar_ramp.txt",
    format="png",
    addAlpha="true"
)
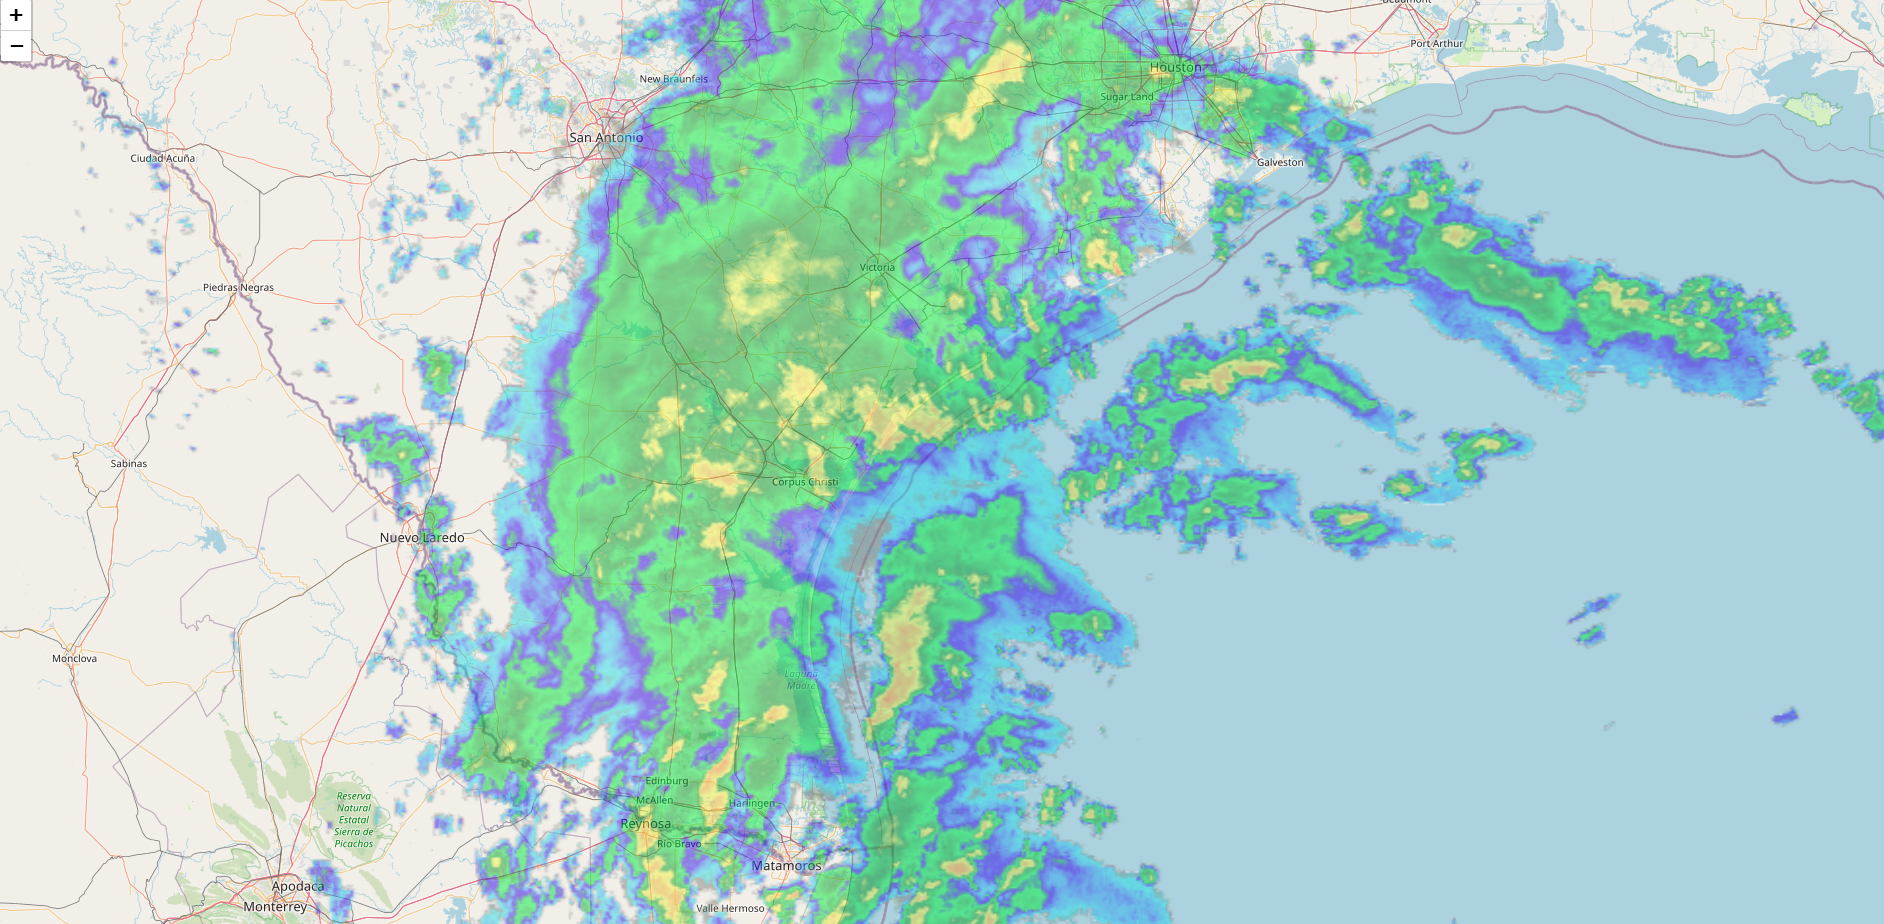
This produces a semi-transparent PNG image with color-coded reflectivity.
![]()
Map It
To place the image on a map, extract its geographic bounds:
info = gdal.Info(ds, format='json')
print(json.dumps(info['wgs84Extent'], indent=2))
Example output:
{
  "type": "Polygon",
  "coordinates": [
    [
      [-130.0, 55.0],
      [-130.0, 20.0026826],
      [-59.9967935, 20.0026826],
      [-59.9967935, 55.0],
      [-130.0, 55.0]
    ]
  ]
}
The Result
Use the bottom-left and top-right corners in Leaflet:
<!DOCTYPE html>
<html lang="en">

<head>
    <meta charset="utf-8">
    <meta name="viewport" content="width=device-width, initial-scale=1">

    <title>Example MRMS Composite Reflectivity</title>

    <link rel="stylesheet" href="https://unpkg.com/[email protected]/dist/leaflet.css"
        integrity="sha256-p4NxAoJBhIIN+hmNHrzRCf9tD/miZyoHS5obTRR9BMY=" crossorigin="" />
    <script src="https://unpkg.com/[email protected]/dist/leaflet.js"
        integrity="sha256-20nQCchB9co0qIjJZRGuk2/Z9VM+kNiyxNV1lvTlZBo=" crossorigin=""></script>

    <style>
        html,
        body {
            margin: 0;
            padding: 0;
        }

        #map {
            position: absolute;
            top: 0;
            bottom: 0;
            width: 100%;
        }
    </style>
</head>

<body>
    <div id="map"></div>
    <script>
        const bounds = [
            [20.0026826, -130.0], // bottom left
            [55.0, -59.9967935] // top right
        ];

        const map = L.map('map').fitBounds(bounds);

        const tiles = L.tileLayer('https://tile.openstreetmap.org/{z}/{x}/{y}.png', {
            maxZoom: 19,
            attribution: '© <a href="http://www.openstreetmap.org/copyright">OpenStreetMap</a>'
        }).addTo(map);

        map.whenReady(function () {
            L.imageOverlay('./latest.png', bounds, {opacity: 0.5}).addTo(map);
        });
    </script>
</body>
</html>
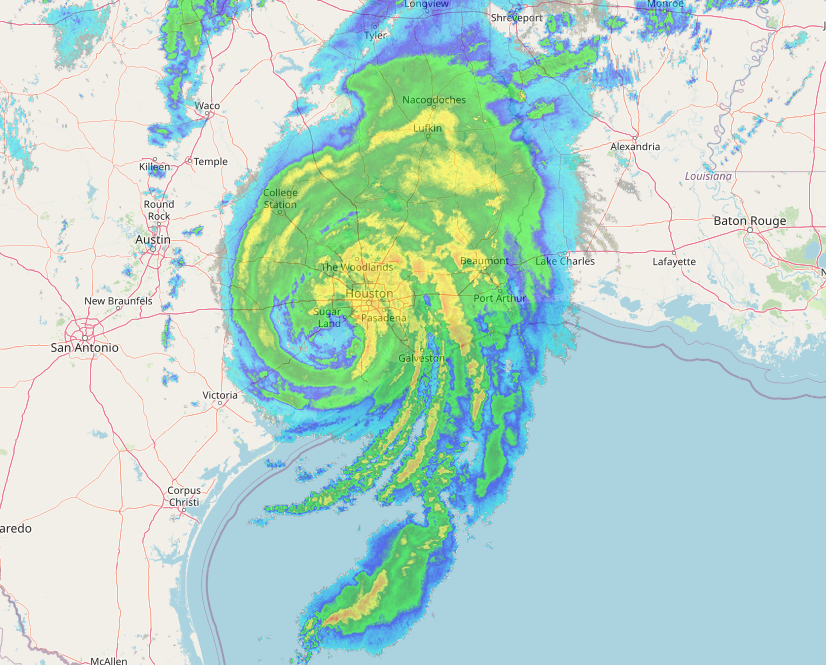
Take five—you now have a functional radar map showing the latest reflectivity data. From here, you can explore animation, auto-refreshing layers, or integrating other weather products.
Want more? Download the full code on GitHub.